Testing agricultural limestone in aquaculture ponds
Products of different quarries may have distinct solubility in water
The study showed that there were significant differences in total alkalinity of water between the various limestone sources, which can be used as an index of solubility.
This study of samples of agricultural limestone obtained from five different quarries in the USA determined that the samples had comparable chemical compositions but somewhat different solubilities in water. It was possible to quickly estimate the relative solubility of different agricultural limestone samples by comparing their specific conductance under standardized conditions. This procedure might be helpful in achieving better results when these products are used in the liming of aquaculture ponds.
Agricultural limestones come from many different locations
Agricultural limestone is widely used in aquaculture to neutralize acidity of bottom soil and increase pH, total alkalinity, and hardness of pond water. Agricultural limestones available in the market comes from many locations, and there likely is variability in the solubility of products from different sources. It would be desirable in aquaculture to use agricultural limestone from sources with the highest solubility. The objective of this study was to assess the solubility of agricultural limestone from five different sources. This article is a summary of the original publication in Aquaculture Research (DOI: 10.1111/are.13250).
Characteristics and solubility of the products
Five different agricultural limestone products were tested for solubility in water. The products were purchased from commercial vendors in Auburn, Alabama (USA). These products originated from limestone mined from five quarries in the USA. The locations of the quarries and the sample identification were: Talking Rock, Ga. (GA-1); Whitestone, Ga. (GA-2); Austinville, Va. (VA); Bonham, Texas (TX); Thomasville, Pa. (PA). The limestone products initially were tested for non-equilibrium pH and concentrations of calcium and magnesium. The purpose of these analyses was to ascertain the type and quality of each product.
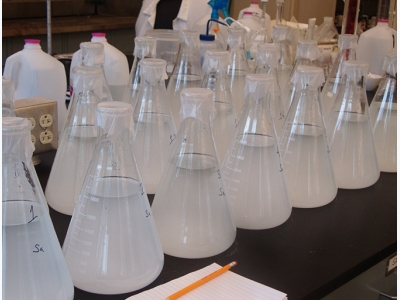
Homogenous aliquots of particles (2.0 g; 0.15 to 0.25 mm fineness) from each sample (GA-1, GA-2, VA, TX and PA) were placed in 4-liter plastic containers containing each 3.5 L of distilled water to measure specific conductance, total alkalinity and calcium concentration. Another four plastic containers received 2.0 grams of analytical grade CaCO3 and distilled water, while four others received only distilled water.
Water samples of 100 mL were removed from flasks before applications of agricultural limestone, 24 hours after application, and weekly for nine weeks. The flasks were set on a laboratory bench at 23 to 25 degrees-C with mouths open to the atmosphere. At the end of each working week, the plastic containers were capped and their contents manually stirred for 10 seconds.

Five different agricultural limestone products plus pure CaCO3 were tested for solubility in water (n = 4).
All agricultural limestone products but just one dolomitic
The average pH of slurry varied between 8.1 and 9.7 (Table 1). No product had a pH over 10, which would indicate the presence of burned or hydrated lime. Therefore, all five samples tested were verified to be “agricultural limestone” as declared on the bags. The range of calcium concentration for the five agricultural limestone samples was 19.8 to 32.1 percent. The average concentration of magnesium in products varied between 3.2 and 12.2 percent. Because a product needs 12 percent or more magnesium to be correctly labeled as dolomitic limestone, only the sample VA with 12.2 ± 0.2 percent Mg was dolomitic.
The other products, i.e. GA-1, GA-2, TX and PA should be identified as “ordinary limestone” because their magnesium concentration ranged between 2 and 12 percent.
| Source (1) | Variable Ca (%) | Variable Mg (%) | Variable: pH of sturry | ID (2) |
| GA-1 | 30.8 ± 1.3 a3 | 4.0 ± 0.4 c | 8.1 ± 0.1 d | Ordinary limestone |
| GA-2 | 30.8 ± 1.3 a3 | 4.6 ± 0.6 c | 8.4 ± 0.1 c | Ordinary limestone |
| VA | 19.8 ± 0.2 b | 12.2 ± 0.2 a | 9.7 ± 0.1 a | Dolomitic limestone |
| TX | 20.1 ± 0.5 b | 10.7 ± 1.1 b | 9.0 ± 0.1 b | Ordinary limestone |
| PA | 32.1 ± 0.6 a | 3.2 ± 0.6 c | 9.6 ± 0.1 a | Ordinary limestone |
| P (4) | <0.001 | <0.001 | <0.001 |
Significant differences on water solubility between limestone sources
After twenty-four hours, specific conductance (SC) was higher in flasks with samples PA, GA-1 and GA-2. The other samples had lower SC (Fig. 1). The ability of water to conduct electricity increases as the total concentration of dissolved ions increases and a high SC value suggested greater solubility. Thus, samples GA-1, GA-2 and PA dissolved faster than the other two samples. Over time, SC increased progressively for all samples but following different patterns.

Fig. 1: Specific conductance of water after the application of the same amount of agricultural limestone from different sources to the water (n = 4). All products are from quarries in the USA. At the last day, means with distinct letters are significantly different between themselves by the Games-Howell’s test (P<0.05).
After 63 days, PA samples presented the highest SC value, which was different from all other samples, including CaCO3. The sample TX had the lowest SC after 63 days. There was reasonable correspondence between the 24-hour (short term) and 63-day (long term) SC results, indicating that the 24-hour SC assessment might be used to quickly evaluate the solubility of different limestone sources in water. Analytical-grade CaCO3 could be used as a standard in such a test.
The greatest total alkalinity (TA) concentrations after 24 hours were observed for GA-1, GA-2 and PA (Fig. 2). There was good correspondence between the 24-hour results for SC and TA in the present work and the use of the 24-hour SC test to a quick evaluation of the solubility of different limestone sources in water is strengthened. The TA concentrations in containers with GA-1, GA-2, VA and PA reached 60 mg L-1 near the day 56.
Difficulty often is encountered in attempting to increase alkalinity above 60 mg L-1 by liming because of the low solubility of limestone. TX reached a TA slightly above 40 mg L-1 after 63 days, and it was significantly inferior in solubility to the other samples. Therefore, there were significant differences between the limestone sources for the TA of water, which can be used as an index of solubility. Despite their similar particle size, the products affected TA differently.

Fig. 2: Total alkalinity of water after the application of the same amount of different sources of agricultural limestone to the water (n = 4). All products are from U.S. quarries. At the last day, means with distinct letters are significantly different between themselves by the Games-Howell’s test (P<0.05).
GA-1, GA-2 and PA samples had higher 24-hour concentrations of Ca2+ than VA and TX samples (Fig. 3). The 24-hour Ca2+ essay might also be a good test to quickly discover limestone sources with poor solubility. VA and TX samples had significantly distinct 24-hour Ca2+ concentrations despite their similar Ca2+ composition. GA-2, GA-1 and PA samples presented concentrations of Ca2+ at day 63 higher than VA and TX samples. Similarly, as was observed after 24 hours, the 63-day Ca2+ concentrations for VA was higher than for TX.

Fig. 3: Concentration of Ca2+ in water after the application of the same amount of different sources of agricultural limestone to the water (n = 4). All products are from U.S. quarries. At the last day, means with distinct letters are significantly different between themselves by the Tukey’s test (P<0.05).
Perspectives
The present results indicate that agricultural limestone products with comparable chemical compositions may have distinct solubility in water. The degree of solubility of different agricultural limestone samples can be quickly evaluated by comparing their specific conductance under standardized conditions (2.0 g samples w/0.15 – 0.25 mm fineness; 3.5 L distilled water; 24 h). This procedure might be helpful in achieving better results when liming aquaculture ponds, i.e., choosing the agricultural limestones with the highest solubilities in water.
Related news
 Inorganic fertilization of production ponds
 The amounts of nitrogen and phosphorus – most important nutrients in aquaculture pond fertilization – applied to ponds should be determined at each farm
 The importance of iron in aquaculture systems
 Iron is an essential element for bacteria, plants, and animals. Many enzymes important in energy transformations contain iron
 Does Coriolis force impact aerator placement in aquaculture ponds?
 I often receive questions about what effect various phenomena or treatments have in aquaculture. Some of these questions must be answered as follows